> ## Documentation Index
> Fetch the complete documentation index at: https://docs.titanos.tv/llms.txt
> Use this file to discover all available pages before exploring further.
# Performance Metrics
Performance analysis for applications on Titan OS devices is done using Chrome DevTools through the Performance tab. This guide covers how to capture performance traces, interpret timeline metrics, and identify whether bottlenecks stem from CPU execution, memory allocation, or network latency.
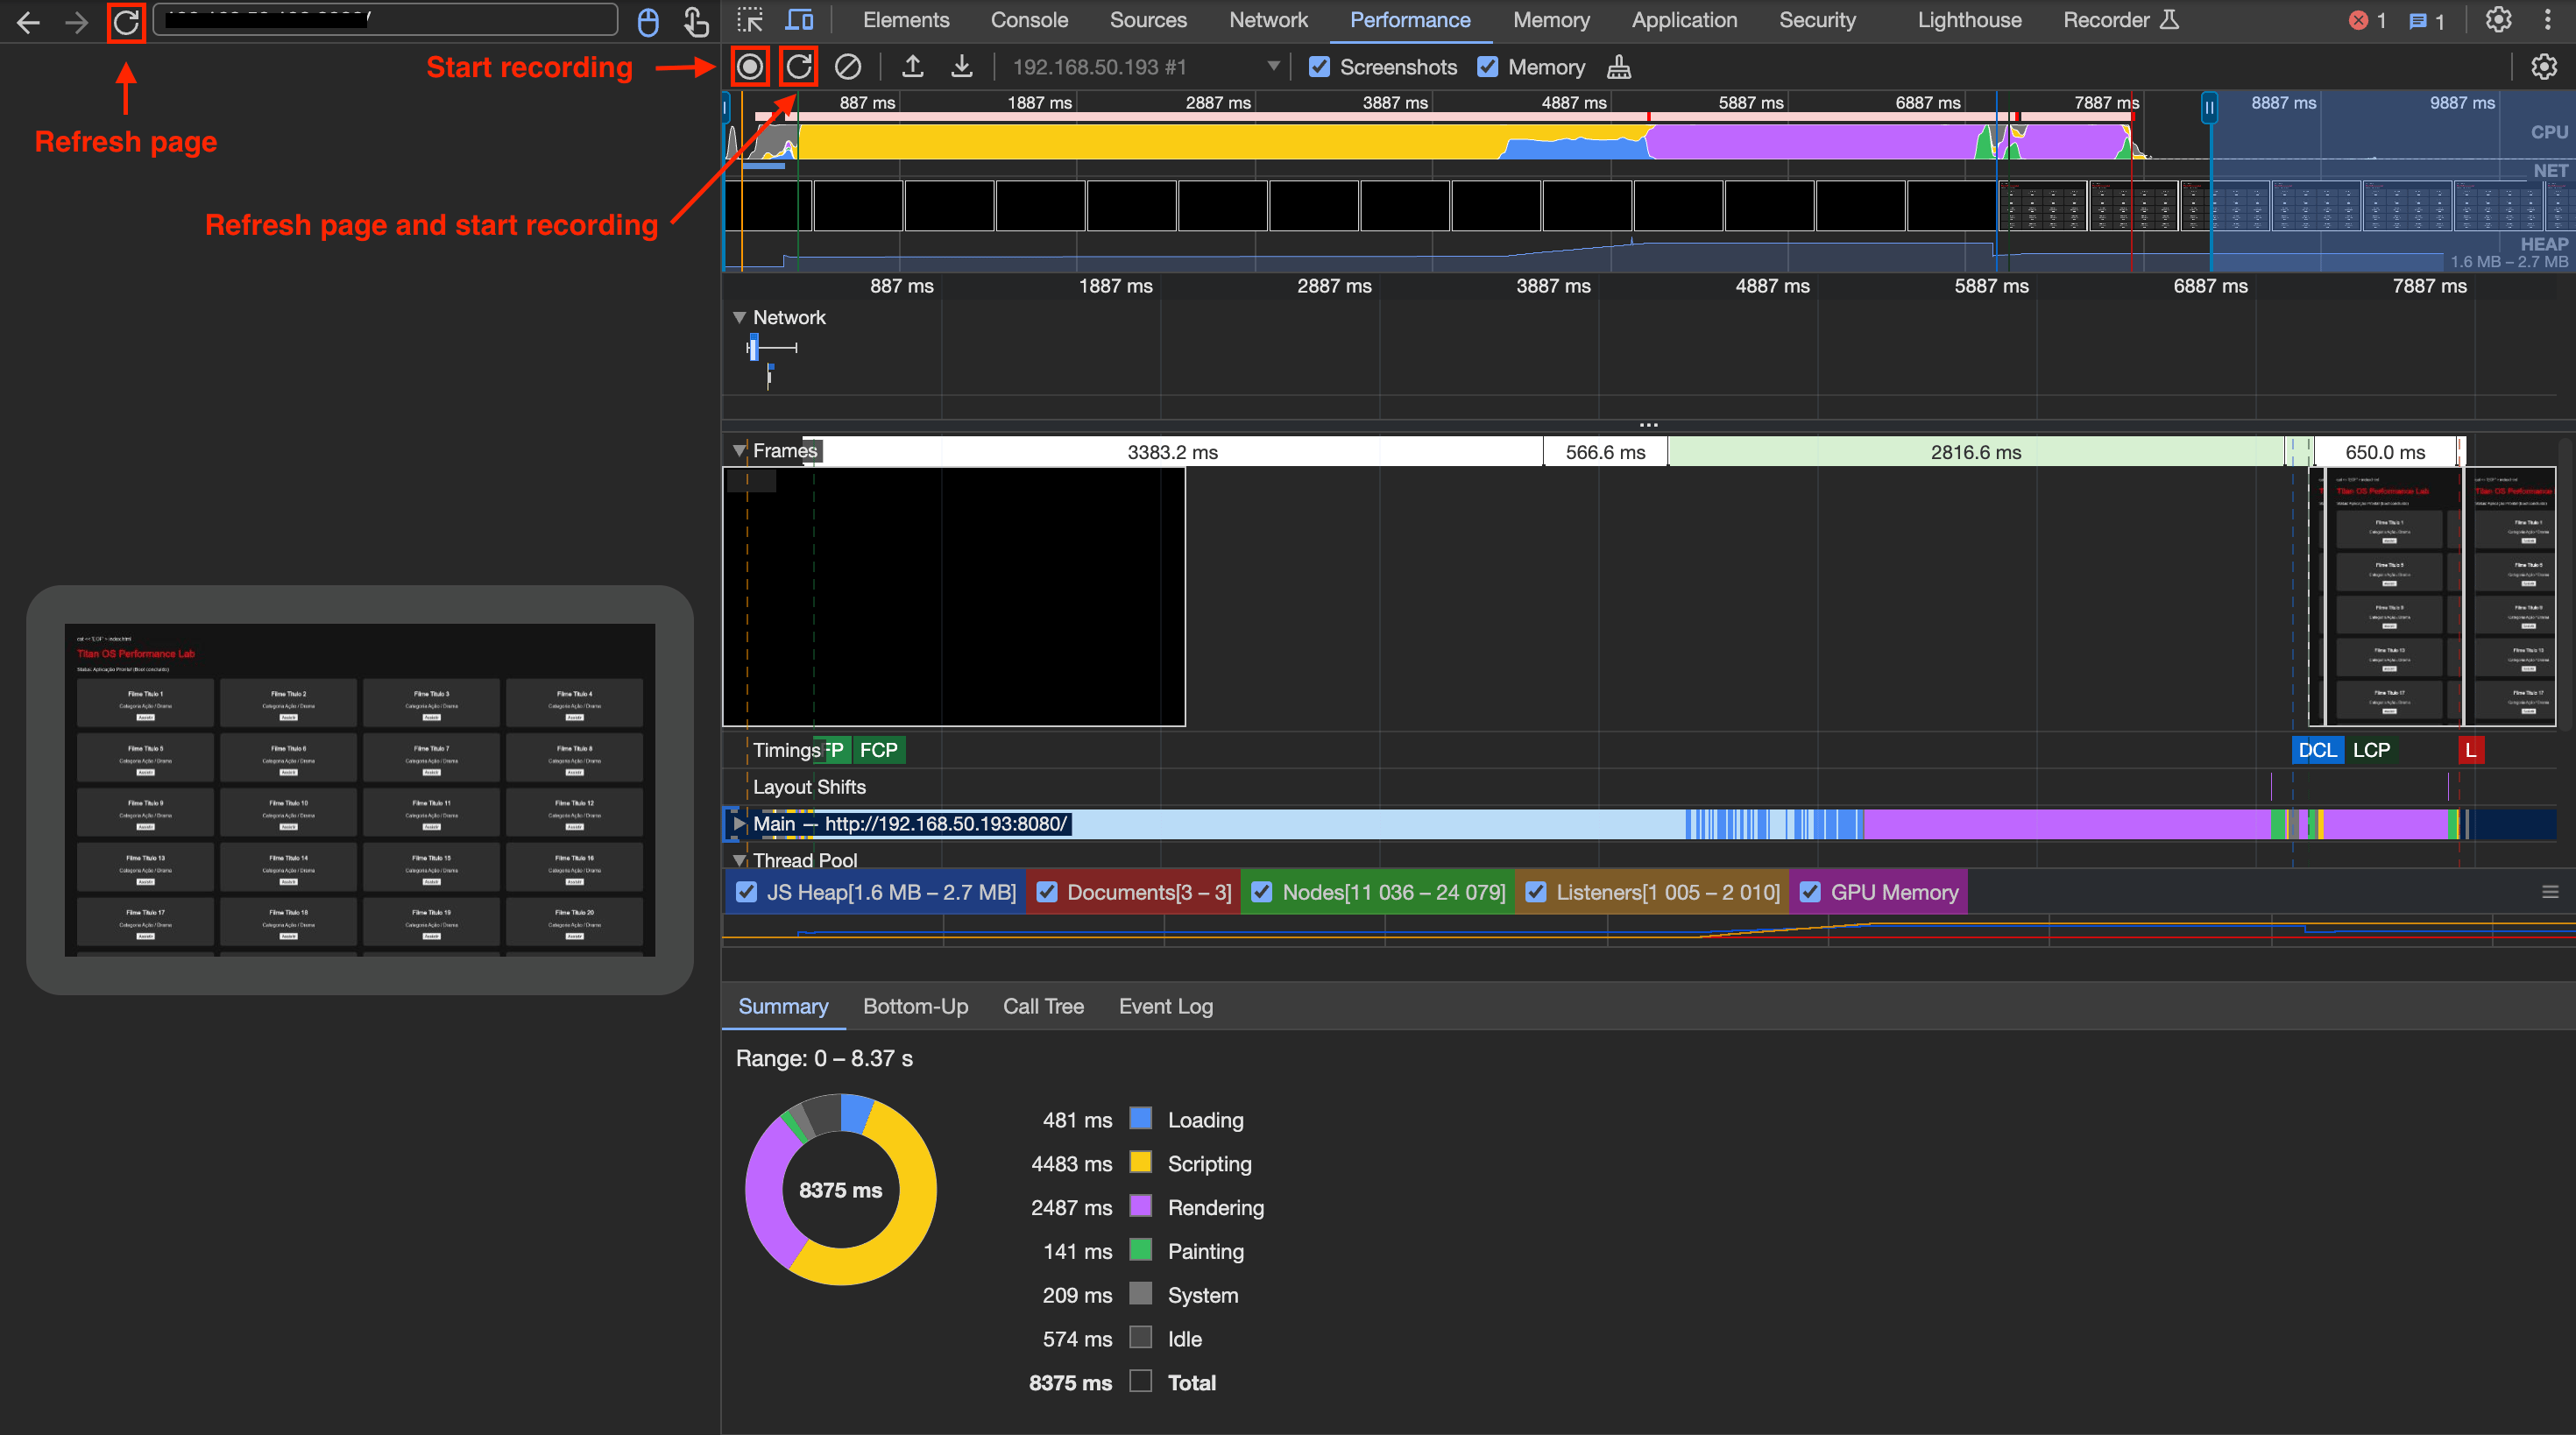
To measure your application’s performance during specific scenarios, such as app startup or user navigation, record the sequence of actions in the Performance tab by capturing a trace of the exact user flow:
1. Select your application instance to open Chrome DevTools using the exact same process described in the [debugging guide](/debugging).
2. Navigate to the **Performance** tab.
3. Click **Record** and start capturing the desired scenario (e.g. reloading the app or navigating through your application to capture specific navigation bottlenecks). Then click **Stop**.
 ## Overview of the performance timeline
When you record a profile in Chrome DevTools, the top timeline panel provides a visual map of how system resources are consumed over time.
## Overview of the performance timeline
When you record a profile in Chrome DevTools, the top timeline panel provides a visual map of how system resources are consumed over time.
 This panel is divided into four tracks that monitor different hardware and browser layers:
* CPU (Main Thread): The colored bar showing overall CPU activity. Saturated blocks indicate peak processor utilization.
* FPS (Frames Per Second): The top green bar indicates screen refresh rates. Dips in this bar signal dropped frames and visual stuttering.
* NET (Network): Displays when network requests, API calls, and bundle downloads are fetched.
* HEAP (Memory): The bottom line tracking active JavaScript RAM allocation over time.
Time indicators are also present at the top and bottom of the panel as time references.
## Understanding the main thread
The Main Thread is the track that monitors the CPU. This section within this timeline represents the primary execution track in the TV browser. It sequentially handles JavaScript execution, CSS style calculations, page layout, visual rendering, and remote control events. This track breaks down CPU activity into four key categories:
* Yellow (`Scripting`): Time spent parsing, compiling, and executing JavaScript code.
* Purple (`Rendering`): Time spent calculating CSS styles and element layout geometry.
* Green (`Painting`): Time spent drawing visual pixels onto the screen.
* Grey (`System`): Browser overhead required to process background tasks.
When any of these blocks (especially the yellow **Scripting** or grey **System** tracks) reach 100% height across the main thread, the TV processor is operating at full capacity.
During periods of full CPU saturation:
* The browser cannot process remote control key inputs (`keydown` events), causing input lag.
* Page layout and visual repaints are paused, causing UI freeze states.
**Note:**
While memory leaks lead to progressive degradation and eventual app crashes, high CPU utilization manifests as immediate unresponsiveness and input lag. The application remains open, but remote control key presses (`keydown` events) are delayed or queued, animations drop frames, and UI state changes feel unresponsive. If this CPU peak occurs during app startup, it directly delays the app initialization.
## Detailed timeline tracks
Below the summary header, the Performance panel provides dedicated tracks where you can inspect blocking tasks, rendering events, and background threads in detail.
* Frames: Displays individual visual render cycles with timestamps and screenshot previews.
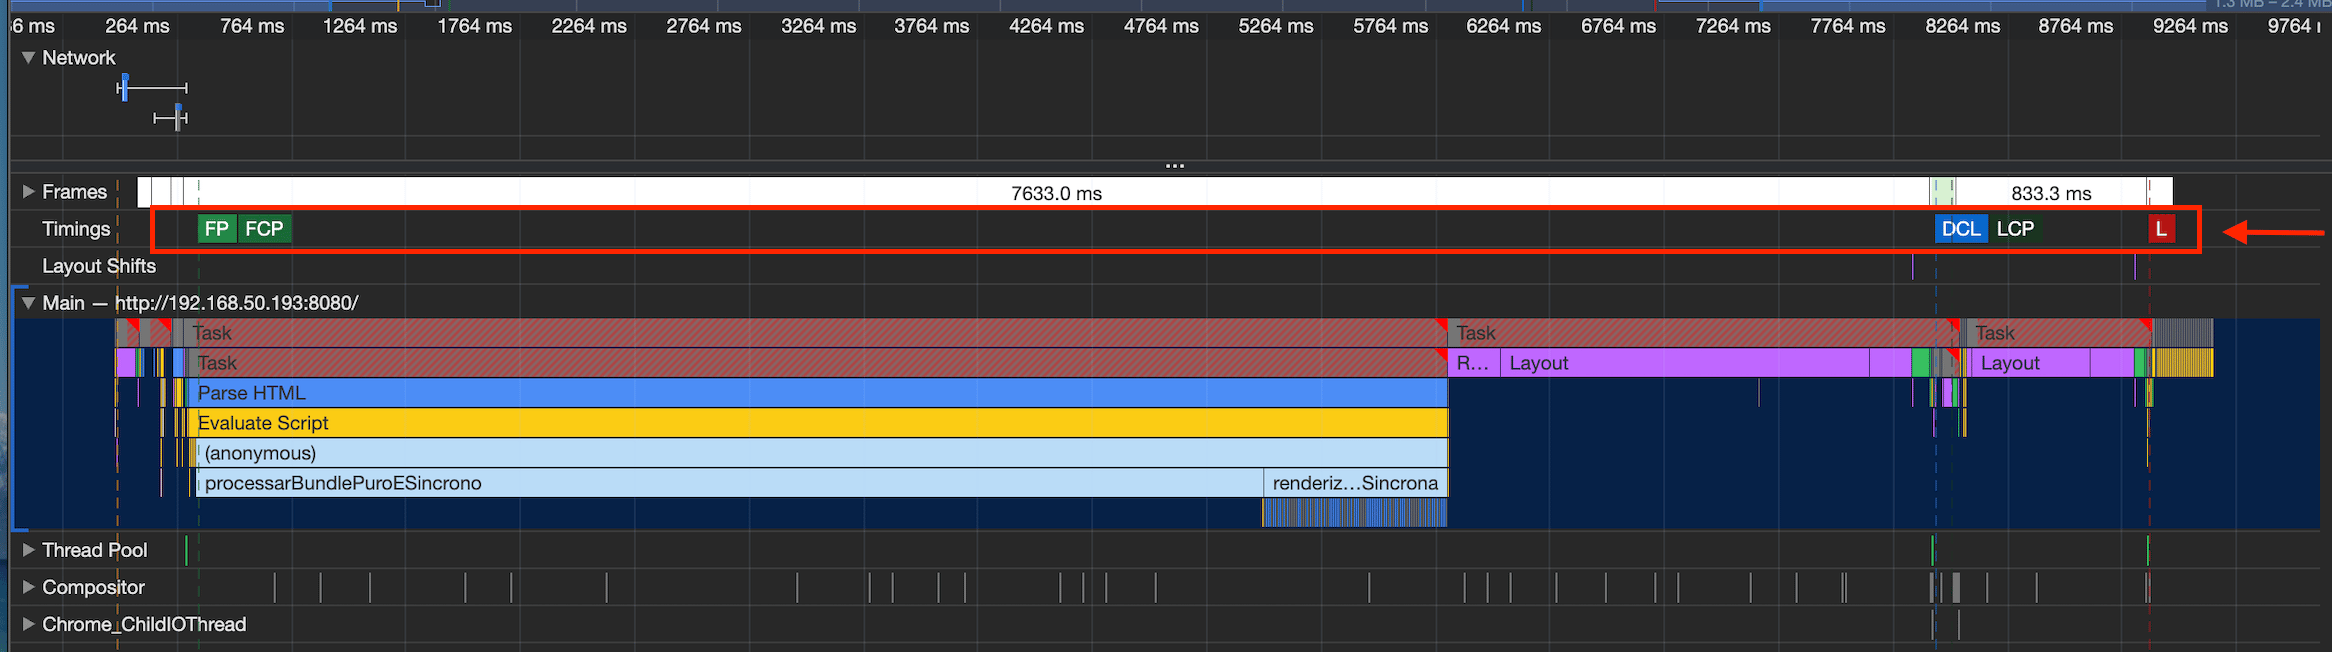
* Timings: Highlights standardized browser lifecycle events (such as `DCL`, `FP`, `FCP`, `LCP` and `L`), making it easy to measure where visual milestones occur during boot.
* Layout shifts: Tracks unexpected layout movement (Cumulative Layout Shift). Highlights visual instability caused by dynamic content or late-loading images shifting the page geometry.
* Main: The primary thread track (detailed above) showing individual task execution blocks, function calls, and Long Tasks flagged with red corner indicators.
* Thread pool: Displays background worker threads managed by the browser engine (such as Web Workers or background image decoding tasks), ensuring they don't block the Main Thread.
## Tracking loading timings (FP, FCP, LCP, DCL)
To measure perceived speed during cold boot (first app initialization), locate the timings row in the performance summary. These metrics mark key rendering moments, such as when the first element appears and when the main interface fully loads:
| Metric | Full Name | Description |
| :----- | :---------------------------------------------------------------------------------------------------------------------- | :-------------------------------------------------------------------------------------------------------------------------- |
| DCL | DOMContentLoaded | The HTML document is fully downloaded and parsed. Synchronous, unoptimized scripts delay this event. |
| FP | First Paint | The moment the TV renders its very first visual change on screen (e.g., changing background color from black to dark gray). |
| FCP | First Contentful Paint | The moment the browser renders the first element of actual DOM content (e.g., logo, text, or button container). |
| LCP | Largest Contentful Paint | The moment the largest above-the-fold visual element finishes rendering (e.g., hero poster banner in the primary carousel). |
| L | Triggers when the page and all dependent resources (stylesheets, scripts, and images) have completely finished loading. | |
This panel is divided into four tracks that monitor different hardware and browser layers:
* CPU (Main Thread): The colored bar showing overall CPU activity. Saturated blocks indicate peak processor utilization.
* FPS (Frames Per Second): The top green bar indicates screen refresh rates. Dips in this bar signal dropped frames and visual stuttering.
* NET (Network): Displays when network requests, API calls, and bundle downloads are fetched.
* HEAP (Memory): The bottom line tracking active JavaScript RAM allocation over time.
Time indicators are also present at the top and bottom of the panel as time references.
## Understanding the main thread
The Main Thread is the track that monitors the CPU. This section within this timeline represents the primary execution track in the TV browser. It sequentially handles JavaScript execution, CSS style calculations, page layout, visual rendering, and remote control events. This track breaks down CPU activity into four key categories:
* Yellow (`Scripting`): Time spent parsing, compiling, and executing JavaScript code.
* Purple (`Rendering`): Time spent calculating CSS styles and element layout geometry.
* Green (`Painting`): Time spent drawing visual pixels onto the screen.
* Grey (`System`): Browser overhead required to process background tasks.
When any of these blocks (especially the yellow **Scripting** or grey **System** tracks) reach 100% height across the main thread, the TV processor is operating at full capacity.
During periods of full CPU saturation:
* The browser cannot process remote control key inputs (`keydown` events), causing input lag.
* Page layout and visual repaints are paused, causing UI freeze states.
**Note:**
While memory leaks lead to progressive degradation and eventual app crashes, high CPU utilization manifests as immediate unresponsiveness and input lag. The application remains open, but remote control key presses (`keydown` events) are delayed or queued, animations drop frames, and UI state changes feel unresponsive. If this CPU peak occurs during app startup, it directly delays the app initialization.
## Detailed timeline tracks
Below the summary header, the Performance panel provides dedicated tracks where you can inspect blocking tasks, rendering events, and background threads in detail.
* Frames: Displays individual visual render cycles with timestamps and screenshot previews.
* Timings: Highlights standardized browser lifecycle events (such as `DCL`, `FP`, `FCP`, `LCP` and `L`), making it easy to measure where visual milestones occur during boot.
* Layout shifts: Tracks unexpected layout movement (Cumulative Layout Shift). Highlights visual instability caused by dynamic content or late-loading images shifting the page geometry.
* Main: The primary thread track (detailed above) showing individual task execution blocks, function calls, and Long Tasks flagged with red corner indicators.
* Thread pool: Displays background worker threads managed by the browser engine (such as Web Workers or background image decoding tasks), ensuring they don't block the Main Thread.
## Tracking loading timings (FP, FCP, LCP, DCL)
To measure perceived speed during cold boot (first app initialization), locate the timings row in the performance summary. These metrics mark key rendering moments, such as when the first element appears and when the main interface fully loads:
| Metric | Full Name | Description |
| :----- | :---------------------------------------------------------------------------------------------------------------------- | :-------------------------------------------------------------------------------------------------------------------------- |
| DCL | DOMContentLoaded | The HTML document is fully downloaded and parsed. Synchronous, unoptimized scripts delay this event. |
| FP | First Paint | The moment the TV renders its very first visual change on screen (e.g., changing background color from black to dark gray). |
| FCP | First Contentful Paint | The moment the browser renders the first element of actual DOM content (e.g., logo, text, or button container). |
| LCP | Largest Contentful Paint | The moment the largest above-the-fold visual element finishes rendering (e.g., hero poster banner in the primary carousel). |
| L | Triggers when the page and all dependent resources (stylesheets, scripts, and images) have completely finished loading. | |
 ## Memory (RAM)
The HEAP (Memory) track at the bottom of the timeline shows JavaScript memory allocation over time.
A healthy memory displays a sawtooth shape. Memory rises as users navigate through views and drops when the browser's Garbage Collector (GC) releases unmounted components. A memory leak displays a continuous increase in the graph. This can be caused by unreleased event listeners, retained DOM nodes, or uncleaned image caches that prevent GC, causing memory to stay high after navigation.
Unlike high CPU usage which keeps the app open but slow, exceeding system memory limits causes the TV operating system to abruptly close the web application to protect overall device stability. If your app crashes silently back to the TV launcher without console errors, inspect the Memory panel for uncollected objects rather than looking for syntax bugs.
## Performance across devices
Different TV models across the ecosystem operate with varied hardware specifications, including CPU architecture, clock speeds and other configurations.
Applications running across a multi-device ecosystem can encounter different processing levels. The same JavaScript logic may execute quickly on high-capacity models while requiring more processor cycles on entry level models, causing temporary 100% saturation of the scripting track. However, this is not a rule: a lightweight, well-architected application can run smoothly on an entry-level device, while a heavy application may encounter bottlenecks even on high-end hardware.
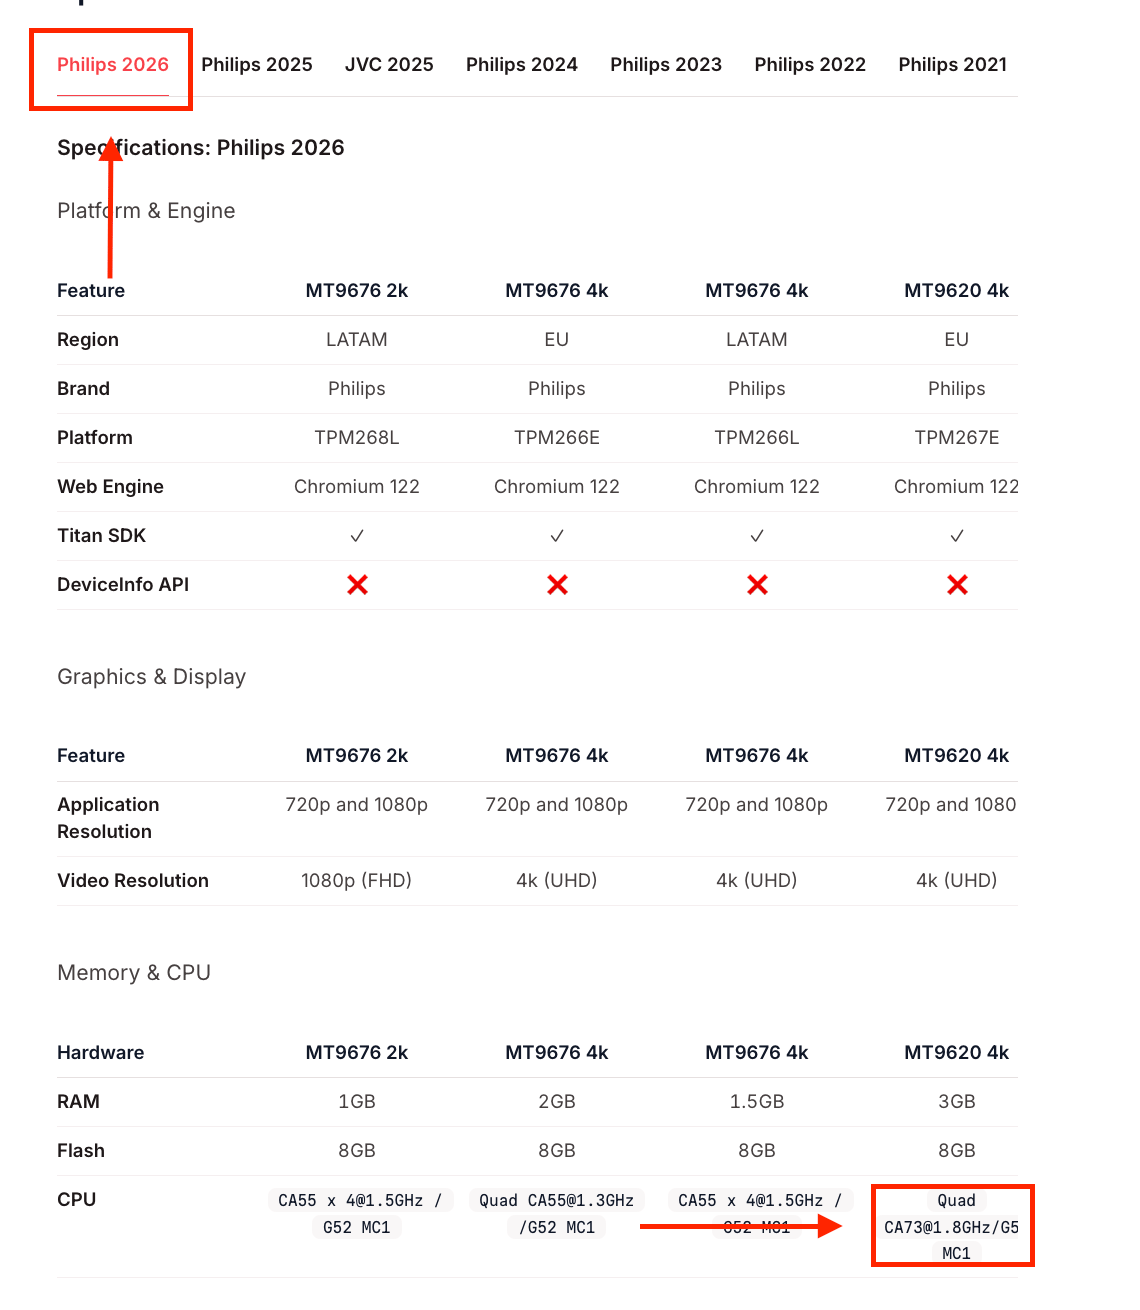
If your application exhibits high CPU saturation or delayed rendering metrics (FCP/LCP) on specific device profiles, inspect the Performance timeline to identify areas where execution tasks can be deferred or yield control back to the browser. And to identify what is the device configuration, such as RAM or CPU clock speed, you can refer to the [Device Specifications](/platform-versions) page.
**Note:**
To identify the clock speed, go to the [Device Specifications](/platform-versions) and check the CPU configuration at the "Memory & CPU" section. The clock speed is the number included in the name. For example, for the CPU `Quad CA73@1.8GHz/G57 MC1`, the clock speed is the 1.8.
Clock speed heavily influences app performance. An app may run smoothly on one TV but experience less performance on another if the devices have different CPU clock speeds despite having the same RAM.
## Memory (RAM)
The HEAP (Memory) track at the bottom of the timeline shows JavaScript memory allocation over time.
A healthy memory displays a sawtooth shape. Memory rises as users navigate through views and drops when the browser's Garbage Collector (GC) releases unmounted components. A memory leak displays a continuous increase in the graph. This can be caused by unreleased event listeners, retained DOM nodes, or uncleaned image caches that prevent GC, causing memory to stay high after navigation.
Unlike high CPU usage which keeps the app open but slow, exceeding system memory limits causes the TV operating system to abruptly close the web application to protect overall device stability. If your app crashes silently back to the TV launcher without console errors, inspect the Memory panel for uncollected objects rather than looking for syntax bugs.
## Performance across devices
Different TV models across the ecosystem operate with varied hardware specifications, including CPU architecture, clock speeds and other configurations.
Applications running across a multi-device ecosystem can encounter different processing levels. The same JavaScript logic may execute quickly on high-capacity models while requiring more processor cycles on entry level models, causing temporary 100% saturation of the scripting track. However, this is not a rule: a lightweight, well-architected application can run smoothly on an entry-level device, while a heavy application may encounter bottlenecks even on high-end hardware.
If your application exhibits high CPU saturation or delayed rendering metrics (FCP/LCP) on specific device profiles, inspect the Performance timeline to identify areas where execution tasks can be deferred or yield control back to the browser. And to identify what is the device configuration, such as RAM or CPU clock speed, you can refer to the [Device Specifications](/platform-versions) page.
**Note:**
To identify the clock speed, go to the [Device Specifications](/platform-versions) and check the CPU configuration at the "Memory & CPU" section. The clock speed is the number included in the name. For example, for the CPU `Quad CA73@1.8GHz/G57 MC1`, the clock speed is the 1.8.
Clock speed heavily influences app performance. An app may run smoothly on one TV but experience less performance on another if the devices have different CPU clock speeds despite having the same RAM.
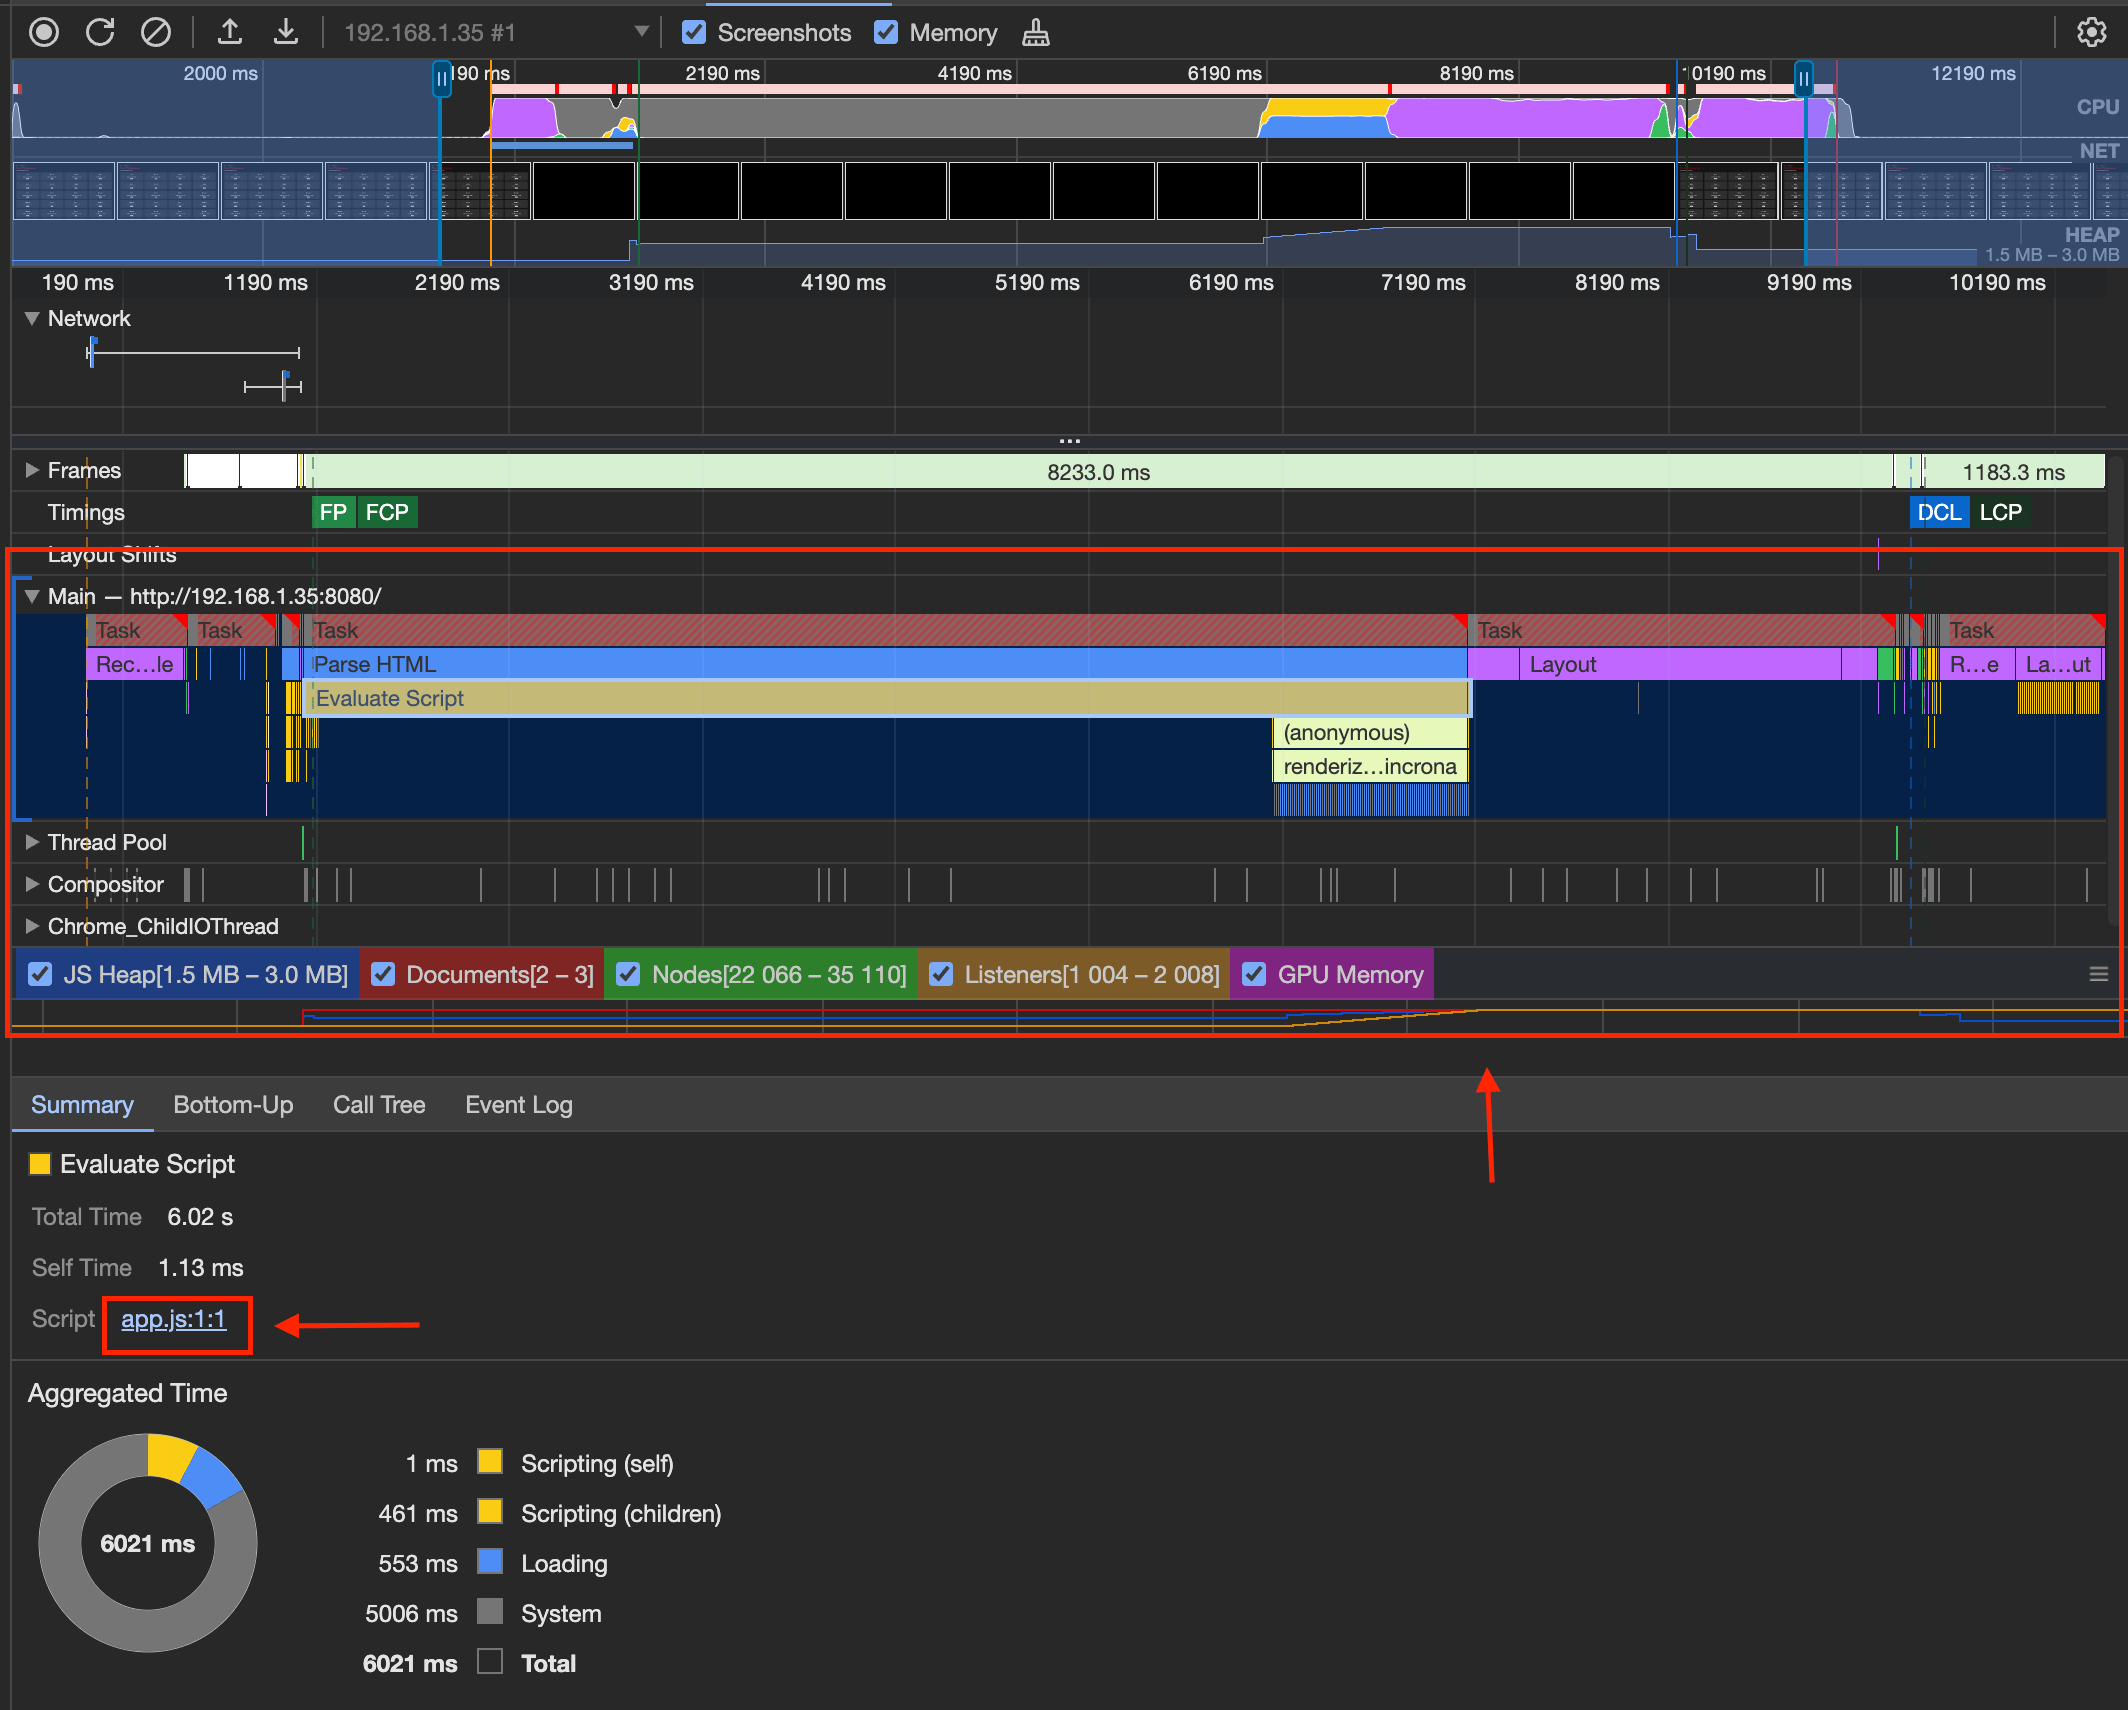
 The image below is a performance recording of an app startup. Note that there're two bars called `long task` and an `evaluate script`. The `long task` means that this task is a javascript code which in process and that blocks the other tasks in the queue to be executed (navigation with remote control, other functions etc). The `evaluate script` is where you can get more information on the specific function or file which causing it. Once you click on it, you can see this information at the summary tab below.
 ## Hardware specifications & API references
To review platform metrics and hardware categories across Titan OS device models, consult our official [Device Specifications](/platform-versions) page.
If your application needs to adapt feature complexity or runtime logic based on device profiles, refer to the [Titan SDK](/titan-sdk) documentation.
### Next steps
Once you have diagnosed performance bottlenecks using DevTools, explore techniques to optimize execution in our next guide: [Optimization Strategies (Task Chunking, Code Splitting & Prefetching)](#).
## Hardware specifications & API references
To review platform metrics and hardware categories across Titan OS device models, consult our official [Device Specifications](/platform-versions) page.
If your application needs to adapt feature complexity or runtime logic based on device profiles, refer to the [Titan SDK](/titan-sdk) documentation.
### Next steps
Once you have diagnosed performance bottlenecks using DevTools, explore techniques to optimize execution in our next guide: [Optimization Strategies (Task Chunking, Code Splitting & Prefetching)](#).