> ## Documentation Index
> Fetch the complete documentation index at: https://docs.titanos.tv/llms.txt
> Use this file to discover all available pages before exploring further.
# Debugging your app
This guide provides step-by-step instructions for debugging applications on Titan OS. The process varies slightly depending on your TV manufacturer.
## Debbuging on Philips devices
Ensure both your TV and PC are connected to the same network.
Open the DevView app on your TV. If you're not familiar with DevView, please refer to the [how to test on your TV](https://docs.titanos.tv/devviewinstall) documentation.
* Navigate to the Settings menu.
* Toggle the "Enable Debug Mode" option to ON. Your TV is now ready for debugging.
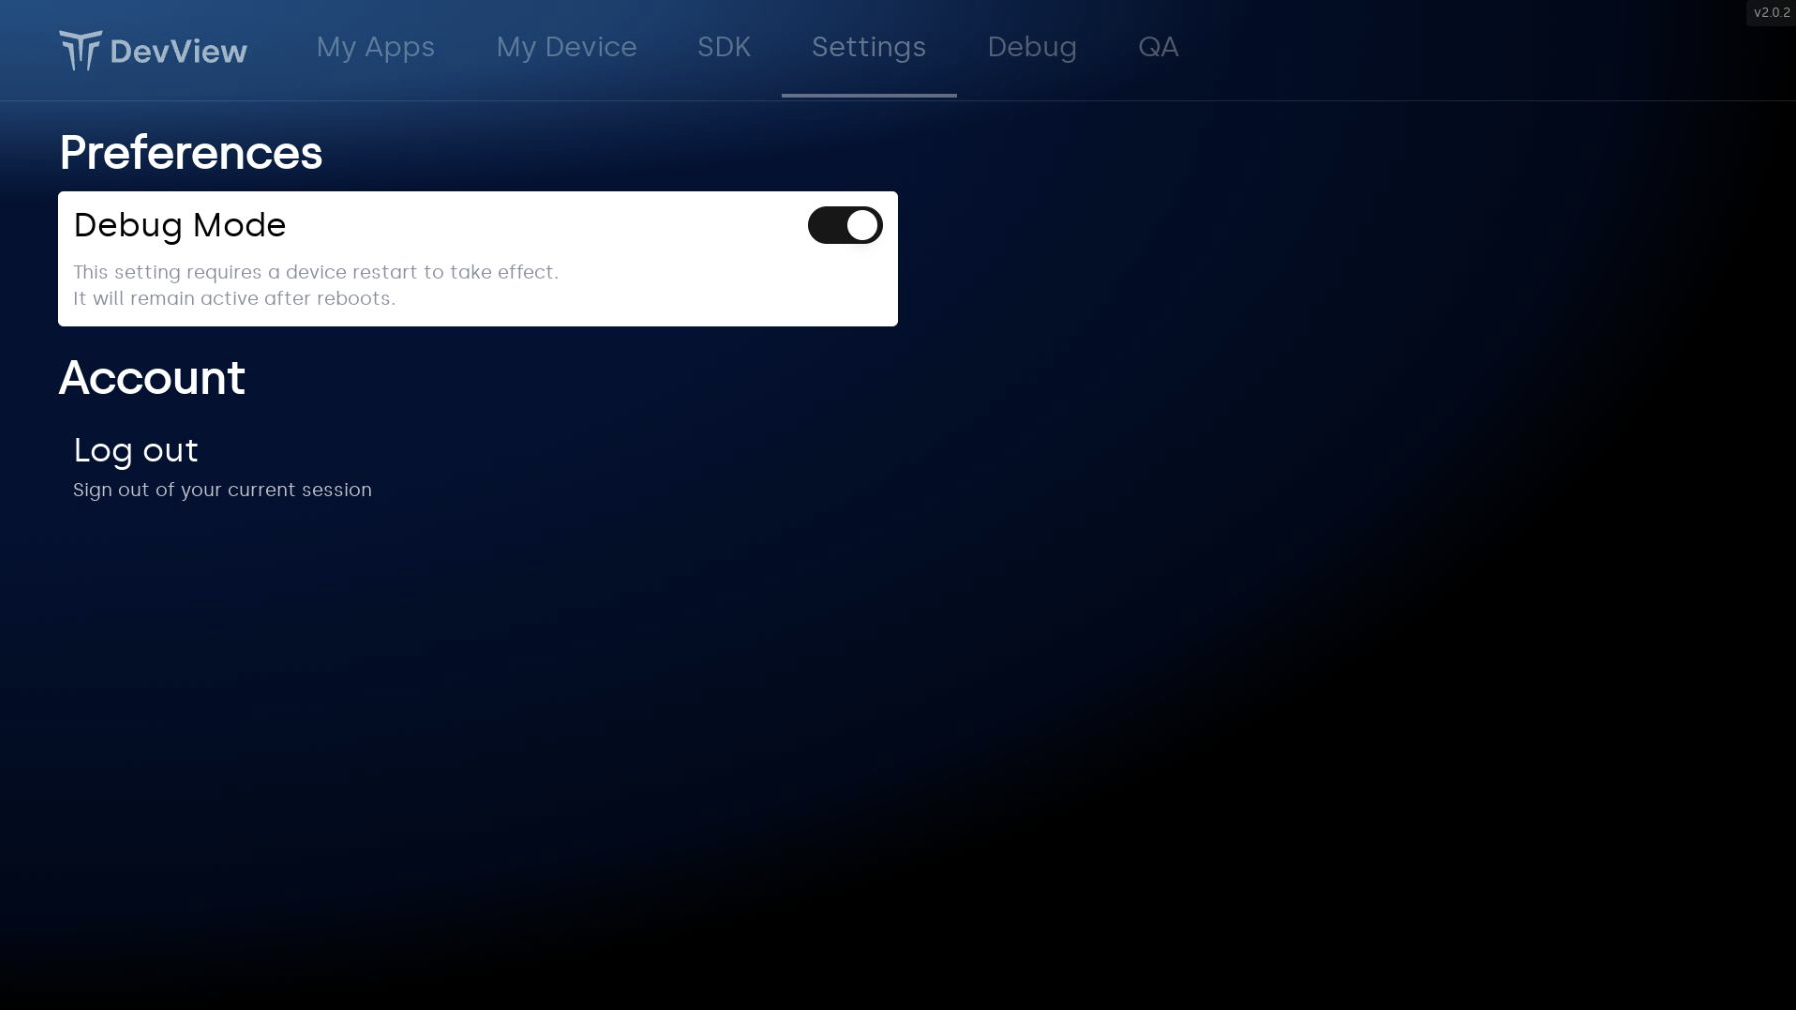 It should enable the debug mode on this device. From that point your device should becomes visible by chrome inspect.
* Open Chrome on your PC and enter chrome://inspect/devices.
* Check the "Discover network targets" option and click on "Configure."
* Enter the TV's local IP address and port number (e.g., `:9222` or `:7001`). Some devices have the port fixed at `9222`, and some others `7001`. It's expected if only one of them works.
* After configuration, Chrome will display the URLs opened on the TV.
* Click "inspect" to open Chrome Devtools and debug the page loaded on the TV.
## Debbuging on Vestel devices
For Vestel devices, debugging is enabled by default though port `4725`. You can connect to your TV directly without changing any settings in DevView.
* Open Chrome on your PC and enter chrome://inspect/devices.
* Check the "Discover network targets" option and click on "Configure."
* Enter the TV's local IP address and port number (e.g., `:4725`). The port number is fixed at `4725`.
* After configuration, Chrome will display the URLs opened on the TV.
* Click "inspect" to open Chrome Devtools and debug the page loaded on the TV.
## Debugging on Philips 2020-2022
For partners who owns Philips devices from 2020 to 2022, these devices require a special "debug firmware" to enable debugging. This process involves a "package burn" to flash a new firmware version onto the device.
* To get started, you'll need to contact our support team ([apponboarding@titanos.tv](mailto:apponboarding@titanos.tv)) to obtain the correct debug firmware file for your TV model.
* For step-by-step instructions on how to install debug firmware, please see our [Firmware Installation Guide]().
Once the firmware is installed, you can proceed to debug it in your chrome browser by doing the following steps:
* Open Chrome on your PC and enter chrome://inspect/devices.
* Check the "Discover network targets" option and click on "Configure."
* Enter the TV's local IP address and port number (e.g., `:7001`). The port number for Philips from 2020 to 2022 is fixed at `7001`.
* After configuration, Chrome will display the URLs opened on the TV.
* Click "inspect" to open Chrome Devtools and debug the page loaded on the TV.
## Chromium 135+ Compatibility Note
Starting with Chrome version 135 and newer, developers may experience issues where the Network Throttling (under the Network tab) and Local Storage (under the Application tab) in DevTools, appear completely empty when inspecting smart TV applications. This is a known behavior with modern Chromium remote debugging across various TV brands.
If your workflow heavily relies on network performance simulation or inspecting local storage data, please utilize the following workarounds to remain unblocked:
**Downloading a Compatible Chromium Version**
If you strictly require the visual Network Throttling panel or the graphical Local Storage UI, you must use a version of Chrome older than version 135:
* Open your terminal or command prompt.
* Navigate to the folder where you want to download the browser.
* Run the following command to download and extract Chrome version 134:
```bash theme={null}
npx @puppeteer/browsers install chrome@134
```
**Note:** You can replace 134 with any preferred older version stable for your ecosystem. Find more details on how to download other chromium versions at the [Chromium Org: Chrome for testing link](https://www.chromium.org/getting-involved/download-chromium/#chrome-for-testing).
* Open the downloaded executable file inside the newly created folder to launch your dedicated debugging browser.
**Managing Local Storage via the Console**
Alternatively, if you are using Chrome 135+ and only need to read, write, or inspect local storage properties, you can interact with it directly via the Console tab using standard JavaScript methods:
View all stored data:
```javascript theme={null}
console.table(localStorage);
```
Retrieve a specific value:
```javascript theme={null}
localStorage.getItem('KeyName');
```
Set or update a value:
```javascript theme={null}
localStorage.setItem('KeyName', 'Value');
```
Learn how to test your app using DevView.
Learn how to learn how install or update the firmware version.
It should enable the debug mode on this device. From that point your device should becomes visible by chrome inspect.
* Open Chrome on your PC and enter chrome://inspect/devices.
* Check the "Discover network targets" option and click on "Configure."
* Enter the TV's local IP address and port number (e.g., `:9222` or `:7001`). Some devices have the port fixed at `9222`, and some others `7001`. It's expected if only one of them works.
* After configuration, Chrome will display the URLs opened on the TV.
* Click "inspect" to open Chrome Devtools and debug the page loaded on the TV.
## Debbuging on Vestel devices
For Vestel devices, debugging is enabled by default though port `4725`. You can connect to your TV directly without changing any settings in DevView.
* Open Chrome on your PC and enter chrome://inspect/devices.
* Check the "Discover network targets" option and click on "Configure."
* Enter the TV's local IP address and port number (e.g., `:4725`). The port number is fixed at `4725`.
* After configuration, Chrome will display the URLs opened on the TV.
* Click "inspect" to open Chrome Devtools and debug the page loaded on the TV.
## Debugging on Philips 2020-2022
For partners who owns Philips devices from 2020 to 2022, these devices require a special "debug firmware" to enable debugging. This process involves a "package burn" to flash a new firmware version onto the device.
* To get started, you'll need to contact our support team ([apponboarding@titanos.tv](mailto:apponboarding@titanos.tv)) to obtain the correct debug firmware file for your TV model.
* For step-by-step instructions on how to install debug firmware, please see our [Firmware Installation Guide]().
Once the firmware is installed, you can proceed to debug it in your chrome browser by doing the following steps:
* Open Chrome on your PC and enter chrome://inspect/devices.
* Check the "Discover network targets" option and click on "Configure."
* Enter the TV's local IP address and port number (e.g., `:7001`). The port number for Philips from 2020 to 2022 is fixed at `7001`.
* After configuration, Chrome will display the URLs opened on the TV.
* Click "inspect" to open Chrome Devtools and debug the page loaded on the TV.
## Chromium 135+ Compatibility Note
Starting with Chrome version 135 and newer, developers may experience issues where the Network Throttling (under the Network tab) and Local Storage (under the Application tab) in DevTools, appear completely empty when inspecting smart TV applications. This is a known behavior with modern Chromium remote debugging across various TV brands.
If your workflow heavily relies on network performance simulation or inspecting local storage data, please utilize the following workarounds to remain unblocked:
**Downloading a Compatible Chromium Version**
If you strictly require the visual Network Throttling panel or the graphical Local Storage UI, you must use a version of Chrome older than version 135:
* Open your terminal or command prompt.
* Navigate to the folder where you want to download the browser.
* Run the following command to download and extract Chrome version 134:
```bash theme={null}
npx @puppeteer/browsers install chrome@134
```
**Note:** You can replace 134 with any preferred older version stable for your ecosystem. Find more details on how to download other chromium versions at the [Chromium Org: Chrome for testing link](https://www.chromium.org/getting-involved/download-chromium/#chrome-for-testing).
* Open the downloaded executable file inside the newly created folder to launch your dedicated debugging browser.
**Managing Local Storage via the Console**
Alternatively, if you are using Chrome 135+ and only need to read, write, or inspect local storage properties, you can interact with it directly via the Console tab using standard JavaScript methods:
View all stored data:
```javascript theme={null}
console.table(localStorage);
```
Retrieve a specific value:
```javascript theme={null}
localStorage.getItem('KeyName');
```
Set or update a value:
```javascript theme={null}
localStorage.setItem('KeyName', 'Value');
```
Learn how to test your app using DevView.
Learn how to learn how install or update the firmware version.